Preprocessing the data of scRNA-seq [Rust / out-of-memory]#
This tutorial demonstrates omicverse’s Rust-backed out-of-memory path (AnnDataOOM) for preprocessing scRNA-seq without loading the full expression matrix into memory.
The expression matrix stays on disk (HDF5, via the anndataoom package, which wraps scverse/anndata-rs). All operations — QC, normalization, HVG selection, scaling, PCA — use chunked iteration or lazy transforms.
Install:
pip install omicverse[rust]
# or just the backend
pip install anndataoom
import omicverse as ov
import numpy as np
import pandas as pd
import matplotlib.pyplot as plt
import psutil, os, time, gc

ov.plot_set()

process = psutil.Process(os.getpid())
def mem_mb():
    gc.collect()
    return process.memory_info().rss / 1024**2

mem_log = []
time_log = {}
def snap(label):
    m = mem_mb()
    mem_log.append({'step': label, 'mem_mb': m})
    print(f"  [{label}] RSS = {m:.0f} MB")
🔬 Starting plot initialization...
🧬 Detecting GPU devices…
✅ NVIDIA CUDA GPUs detected: 1
    • [CUDA 0] NVIDIA H100 80GB HBM3
      Memory: 79.1 GB | Compute: 9.0

   ____            _     _    __
  / __ \____ ___  (_)___| |  / /__  _____________
 / / / / __ `__ \/ / ___/ | / / _ \/ ___/ ___/ _ \
/ /_/ / / / / / / / /__ | |/ /  __/ /  (__  )  __/
\____/_/ /_/ /_/_/\___/ |___/\___/_/  /____/\___/

🔖 Version: 2.1.2rc1   📚 Tutorials: https://omicverse.readthedocs.io/
✅ plot_set complete.
1. Download PBMC 8k dataset#
We’ll use the PBMC 8k dataset from 10x Genomics (7750 cells × 20939 genes).
h5ad_path = './data/pbmc8k.h5ad'

if not os.path.exists(h5ad_path):
    print('Downloading PBMC 8k...')
    os.makedirs('./data', exist_ok=True)
    adata_init = ov.datasets.pbmc8k()
    adata_init.write(h5ad_path)
    print(f'Saved to {h5ad_path} ({os.path.getsize(h5ad_path)/1024/1024:.1f} MB)')
    del adata_init
    gc.collect()
else:
    print(f'Dataset already exists: {h5ad_path}')
Dataset already exists: ./data/pbmc8k.h5ad
2. Read with Rust backend#
ov.read(path, backend='rust') returns AnnDataOOM — expression matrix stays on disk.
snap('baseline')

t0 = time.time()
adata = ov.read(h5ad_path, backend='rust')
time_log['read'] = time.time() - t0
snap('after read')
print(adata)
[baseline] RSS = 645 MB
📂 Reading with anndata-rs (Rust · out-of-memory)
   ./data/pbmc8k.h5ad  (39.5 MB)
   ✓ Loaded in 0.15s

💡 Data stays on disk. Use ov.pp.* for chunked processing.
   adata.close() when done · adata.to_adata() to materialise
[after read] RSS = 720 MB
╭────────────────────────────────────────────────────────────────────────╮
│ AnnDataOOM                               Rust · out-of-memory · backed │
├────────────────────────────────────────────────────────────────────────┤
│                                                                        │
│    7,750   ×   20,939                                                  │
│    obs          vars                                                   │
│                                                                        │
│    csr_matrix · float32 · 9.9% density · ~15.8 MB/chunk (1,000 rows) · │
│    pbmc8k.h5ad                                                         │
│                                                                        │
├────────────────────────────────────────────────────────────────────────┤
│ ▸ obs    (21)   kit · tissue_ontology_term_id · tissue_type  +18       │
│ ▸ var    (6)    gene_name · feature_name · feature_reference  +3       │
│ ▸ obsm   (3)    UMAP · X_pca · X_umap                                  │
│ ▸ varm   (–)                                                           │
│ ▸ obsp   (–)                                                           │
│ ▸ varp   (–)                                                           │
│ ▸ layers (–)                                                           │
│ ▸ raw    (–)                                                           │
╰────────────────────────────────────────────────────────────────────────╯
AnnDataOOM API compatibility test#
# Properties
print(f"shape:      {adata.shape}")
print(f"n_obs:      {adata.n_obs}")
print(f"n_vars:     {adata.n_vars}")
print(f"is_view:    {adata.is_view}")
print(f"isbacked:   {adata.isbacked}")
print(f"obs_keys:   {adata.obs_keys()[:5]}...")
print(f"var_keys:   {adata.var_keys()[:3]}...")
shape:      (7750, 20939)
n_obs:      7750
n_vars:     20939
is_view:    False
isbacked:   True
obs_keys:   ['kit', 'tissue_ontology_term_id', 'tissue_type', 'assay_ontology_term_id', 'disease_ontology_term_id']...
var_keys:   ['gene_name', 'feature_name', 'feature_reference']...
# obs / var are pandas DataFrames
adata.obs.head()
                                      kit tissue_ontology_term_id tissue_type  \
obs_names
TGAGCCGTCGATAGAA-1_10X_5-rep1  10X_5-rep1          UBERON:0000178      tissue
TACACGACAGGACGTA-1_10X_5-rep1  10X_5-rep1          UBERON:0000178      tissue
GAAGCAGCAGCTGTGC-1_10X_5-rep1  10X_5-rep1          UBERON:0000178      tissue
CTCACACAGAGCCCAA-1_10X_5-rep1  10X_5-rep1          UBERON:0000178      tissue
CTCGTCAGTGATAAAC-1_10X_5-rep1  10X_5-rep1          UBERON:0000178      tissue

                              assay_ontology_term_id disease_ontology_term_id  \
obs_names
TGAGCCGTCGATAGAA-1_10X_5-rep1            EFO:0009900             PATO:0000461
TACACGACAGGACGTA-1_10X_5-rep1            EFO:0009900             PATO:0000461
GAAGCAGCAGCTGTGC-1_10X_5-rep1            EFO:0009900             PATO:0000461
CTCACACAGAGCCCAA-1_10X_5-rep1            EFO:0009900             PATO:0000461
CTCGTCAGTGATAAAC-1_10X_5-rep1            EFO:0009900             PATO:0000461

                              cell_type_ontology_term_id  \
obs_names
TGAGCCGTCGATAGAA-1_10X_5-rep1                 CL:0001054
TACACGACAGGACGTA-1_10X_5-rep1                 CL:0001054
GAAGCAGCAGCTGTGC-1_10X_5-rep1                 CL:0001054
CTCACACAGAGCCCAA-1_10X_5-rep1                 CL:0000624
CTCGTCAGTGATAAAC-1_10X_5-rep1                 CL:0001054

                              self_reported_ethnicity_ontology_term_id  \
obs_names
TGAGCCGTCGATAGAA-1_10X_5-rep1                                  unknown
TACACGACAGGACGTA-1_10X_5-rep1                                  unknown
GAAGCAGCAGCTGTGC-1_10X_5-rep1                                  unknown
CTCACACAGAGCCCAA-1_10X_5-rep1                                  unknown
CTCGTCAGTGATAAAC-1_10X_5-rep1                                  unknown

                              development_stage_ontology_term_id  \
obs_names
TGAGCCGTCGATAGAA-1_10X_5-rep1                     HsapDv:0000136
TACACGACAGGACGTA-1_10X_5-rep1                     HsapDv:0000136
GAAGCAGCAGCTGTGC-1_10X_5-rep1                     HsapDv:0000136
CTCACACAGAGCCCAA-1_10X_5-rep1                     HsapDv:0000136
CTCGTCAGTGATAAAC-1_10X_5-rep1                     HsapDv:0000136

                              sex_ontology_term_id donor_id  ...  \
obs_names                                                    ...
TGAGCCGTCGATAGAA-1_10X_5-rep1         PATO:0000384   RG1237  ...
TACACGACAGGACGTA-1_10X_5-rep1         PATO:0000384   RG1237  ...
GAAGCAGCAGCTGTGC-1_10X_5-rep1         PATO:0000384   RG1237  ...
CTCACACAGAGCCCAA-1_10X_5-rep1         PATO:0000384   RG1237  ...
CTCGTCAGTGATAAAC-1_10X_5-rep1         PATO:0000384   RG1237  ...

                              predicted_celltype is_primary_data  \
obs_names
TGAGCCGTCGATAGAA-1_10X_5-rep1     CD14+ monocyte            True
TACACGACAGGACGTA-1_10X_5-rep1     CD14+ monocyte            True
GAAGCAGCAGCTGTGC-1_10X_5-rep1     CD14+ monocyte            True
CTCACACAGAGCCCAA-1_10X_5-rep1        CD4+ T cell            True
CTCGTCAGTGATAAAC-1_10X_5-rep1     CD14+ monocyte            True

                                                     cell_type      assay  \
obs_names
TGAGCCGTCGATAGAA-1_10X_5-rep1           CD14-positive monocyte  10x 5' v2
TACACGACAGGACGTA-1_10X_5-rep1           CD14-positive monocyte  10x 5' v2
GAAGCAGCAGCTGTGC-1_10X_5-rep1           CD14-positive monocyte  10x 5' v2
CTCACACAGAGCCCAA-1_10X_5-rep1  CD4-positive, alpha-beta T cell  10x 5' v2
CTCGTCAGTGATAAAC-1_10X_5-rep1           CD14-positive monocyte  10x 5' v2

                              disease   sex tissue self_reported_ethnicity  \
obs_names
TGAGCCGTCGATAGAA-1_10X_5-rep1  normal  male  blood                 unknown
TACACGACAGGACGTA-1_10X_5-rep1  normal  male  blood                 unknown
GAAGCAGCAGCTGTGC-1_10X_5-rep1  normal  male  blood                 unknown
CTCACACAGAGCCCAA-1_10X_5-rep1  normal  male  blood                 unknown
CTCGTCAGTGATAAAC-1_10X_5-rep1  normal  male  blood                 unknown

                               development_stage observation_joinid
obs_names
TGAGCCGTCGATAGAA-1_10X_5-rep1  42-year-old stage         ir4GbxI8Wu
TACACGACAGGACGTA-1_10X_5-rep1  42-year-old stage         OP^!ELHSD3
GAAGCAGCAGCTGTGC-1_10X_5-rep1  42-year-old stage         d!x#H2K(NS
CTCACACAGAGCCCAA-1_10X_5-rep1  42-year-old stage         Wvd<H#T+hs
CTCGTCAGTGATAAAC-1_10X_5-rep1  42-year-old stage         99PkVIhf77

[5 rows x 21 columns]
# Subsetting: slice / bool / gene name / gene list
print(f"adata[0:5]:              {adata[0:5].shape}")
print(f"adata[:, 0:3]:           {adata[:, 0:3].shape}")

gene = adata.var_names[10]
print(f"adata[:, '{gene}']: {adata[:, gene].shape}")

genes = list(adata.var_names[:3])
print(f"adata[:, 3-genes]:       {adata[:, genes].shape}")

# obs_vector — single gene expression
g = adata.var_names[0]
print(f"obs_vector('{g}'): {adata.obs_vector(g).shape}")
adata[0:5]:              (5, 20939)
adata[:, 0:3]:           (7750, 3)
adata[:, 'AL645608.7']: (7750, 1)
adata[:, 3-genes]:       (7750, 3)
obs_vector('AL627309.5'): (7750,)
3. QC (chunked)#
Quality control metrics (nUMIs, detected_genes, mito%) computed via chunked row iteration.
t0 = time.time()
adata = ov.pp.qc(
    adata,
    tresh={'mito_perc': 0.2, 'nUMIs': 500, 'detected_genes': 250},
    doublets=False,
)
time_log['qc'] = time.time() - t0
snap('after QC')
print(f"Shape: {adata.shape}, Time: {time_log['qc']:.1f}s")
🖥️ Using CPU mode for QC (out-of-memory)...
   Auto-detected mitochondrial prefix: 'MT-'

📊 Step 1: Calculating QC Metrics

   ✓ Gene Family Detection:
   ┌──────────────────────────────┬────────────────────┬────────────────────┐
   │ Gene Family                  │ Genes Found        │ Detection Method   │
   ├──────────────────────────────┼────────────────────┼────────────────────┤
   │ Mitochondrial                │ 13                 │ Auto (MT-)         │
   ├──────────────────────────────┼────────────────────┼────────────────────┤
   │ Ribosomal                    │ 99                 │ Auto (RPS/RPL)     │
   ├──────────────────────────────┼────────────────────┼────────────────────┤
   │ Hemoglobin                   │ 7                  │ Auto (regex)       │
   └──────────────────────────────┴────────────────────┴────────────────────┘
   ✓ QC Metrics Summary:
   ┌─────────────────────────┬────────────────────┬─────────────────────────┐
   │ Metric                  │ Mean               │ Range (Min - Max)       │
   ├─────────────────────────┼────────────────────┼─────────────────────────┤
   │ nUMIs                   │ 5454               │ 497 - 34434             │
   ├─────────────────────────┼────────────────────┼─────────────────────────┤
   │ Detected Genes          │ 2071               │ 35 - 6427               │
   ├─────────────────────────┼────────────────────┼─────────────────────────┤
   │ Mitochondrial %         │ 2.9%               │ 0.0% - 97.2%            │
   ├─────────────────────────┼────────────────────┼─────────────────────────┤
   │ Ribosomal %             │ 20.4%              │ 0.1% - 52.8%            │
   ├─────────────────────────┼────────────────────┼─────────────────────────┤
   │ Hemoglobin %            │ 0.0%               │ 0.0% - 0.3%             │
   └─────────────────────────┴────────────────────┴─────────────────────────┘

   📈 Original cell count: 7,750

🔧 Step 2: Quality Filtering (SEURAT)
   Thresholds: mito≤0.2, nUMIs≥500, genes≥250
   📊 Seurat Filter Results:
     • nUMIs filter (≥500): 5 cells failed (0.1%)
     • Genes filter (≥250): 16 cells failed (0.2%)
     • Mitochondrial filter (≤0.2): 40 cells failed (0.5%)
   ✓ Filters applied successfully
   ✓ Combined QC filters: 52 cells removed (0.7%)

🎯 Step 3: Final Filtering
   Parameters: min_genes=200, min_cells=3
   Ratios: max_genes_ratio=1, max_cells_ratio=1
✓ Final filtering: 0 cells, 10 genes removed

📊 Step 4: Doublet detection disabled

╭─ SUMMARY: qc ──────────────────────────────────────────────────────╮
│  Duration: 3.3331s                                                 │
│  Shape:    7,750 x 20,939 -> 7,698 x 20,929                        │
│                                                                    │
│  CHANGES DETECTED                                                  │
│  ────────────────                                                  │
│  ● OBS    │ ✚ cell_complexity (float)                              │
│           │ ✚ detected_genes (int)                                 │
│           │ ✚ hb_perc (float)                                      │
│           │ ✚ mito_perc (float)                                    │
│           │ ✚ nUMIs (float)                                        │
│           │ ✚ passing_mt (bool)                                    │
│           │ ✚ passing_nUMIs (bool)                                 │
│           │ ✚ passing_ngenes (bool)                                │
│           │ ✚ ribo_perc (float)                                    │
│                                                                    │
│  ● VAR    │ ✚ hb (bool)                                            │
│           │ ✚ mt (bool)                                            │
│           │ ✚ n_cell (int)                                         │
│           │ ✚ n_cells (int)                                        │
│           │ ✚ ribo (bool)                                          │
│                                                                    │
│  ● UNS    │ ✚ REFERENCE_MANU                                       │
│           │ ✚ status                                               │
│           │ ✚ status_args                                          │
│                                                                    │
╰────────────────────────────────────────────────────────────────────╯
[after QC] RSS = 770 MB
Shape: (7698, 20929), Time: 3.5s
4. Preprocess (lazy normalize + log1p + chunked HVG)#
t0 = time.time()
adata = ov.pp.preprocess(
    adata, mode='shiftlog|pearson',
    n_HVGs=2000, target_sum=50*1e4,
)
time_log['preprocess'] = time.time() - t0
snap('after preprocess')
print(f"Shape: {adata.shape}, Time: {time_log['preprocess']:.1f}s")
🔍 [2026-04-16 22:33:15] Running preprocessing in 'cpu' mode...
Begin robust gene identification
✅ Robust gene identification completed successfully.
Begin size normalization: shiftlog and HVGs selection pearson
    Time to analyze data (out-of-memory): 6.91 seconds.
✅ Preprocessing completed successfully.
    Added:
        'highly_variable_features', boolean vector (adata.var)
        'means', float vector (adata.var)
        'variances', float vector (adata.var)
        'residual_variances', float vector (adata.var)
        'counts', raw counts layer (adata.layers)
    End of size normalization: shiftlog and HVGs selection pearson

╭─ SUMMARY: preprocess ──────────────────────────────────────────────╮
│  Duration: 7.6664s                                                 │
│  Shape:    7,698 x 20,929 -> 7,698 x 20,064                        │
│                                                                    │
│  CHANGES DETECTED                                                  │
│  ────────────────                                                  │
│  ● OBS    │ ✚ _norm_factor (float)                                 │
│                                                                    │
│  ● VAR    │ ✚ highly_variable (bool)                               │
│           │ ✚ highly_variable_features (bool)                      │
│           │ ✚ highly_variable_intersection (bool)                  │
│           │ ✚ highly_variable_nbatches (int)                       │
│           │ ✚ highly_variable_rank (float)                         │
│           │ ✚ means (float)                                        │
│           │ ✚ percent_cells (float)                                │
│           │ ✚ residual_variances (float)                           │
│           │ ✚ robust (bool)                                        │
│           │ ✚ variances (float)                                    │
│                                                                    │
│  ● LAYERS │ ✚ counts (_SubsetBackedArray)                          │
│                                                                    │
╰────────────────────────────────────────────────────────────────────╯
[after preprocess] RSS = 813 MB
Shape: (7698, 20064), Time: 7.7s
5. HVG + Scale (lazy) + PCA (chunked randomized SVD)#
adata.raw = adata
adata = adata[:, adata.var.highly_variable_features]
print(f'After HVG subset: {adata.shape}')
snap('after HVG subset')

t0 = time.time()
ov.pp.scale(adata)
time_log['scale'] = time.time() - t0

from anndataoom import ScaledBackedArray
print(f"Scale is lazy: {isinstance(adata.layers['scaled'], ScaledBackedArray)}")
snap('after scale')

t0 = time.time()
ov.pp.pca(adata, layer='scaled', n_pcs=50)
time_log['pca'] = time.time() - t0
snap('after PCA')
print(f"Shape: {adata.shape}, PCA: {adata.obsm['X_pca'].shape}")
After HVG subset: (7698, 2000)
  [after HVG subset] RSS = 813 MB
╭─ SUMMARY: scale ───────────────────────────────────────────────────╮
│  Duration: 3.3605s                                                 │
│  Shape:    7,698 x 2,000 (Unchanged)                               │
│                                                                    │
│  CHANGES DETECTED                                                  │
│  ────────────────                                                  │
│  ● LAYERS │ ✚ scaled (ScaledBackedArray)                           │
│                                                                    │
╰────────────────────────────────────────────────────────────────────╯
Scale is lazy: True
  [after scale] RSS = 770 MB
computing PCA🔍
    with n_comps=50
╭─ SUMMARY: pca ─────────────────────────────────────────────────────╮
│  Duration: 36.7142s                                                │
│  Shape:    7,698 x 2,000 (Unchanged)                               │
│                                                                    │
│  CHANGES DETECTED                                                  │
│  ────────────────                                                  │
│  ● UNS    │ ✚ pca                                                  │
│           │ ✚ scaled|original|cum_sum_eigenvalues                  │
│           │ ✚ scaled|original|pca_var_ratios                       │
│                                                                    │
│  ● OBSM   │ ✚ scaled|original|X_pca (array, 7698x50)               │
│                                                                    │
╰────────────────────────────────────────────────────────────────────╯
[after PCA] RSS = 799 MB
Shape: (7698, 2000), PCA: (7698, 50)
6. Neighbors + UMAP + Leiden#
t0 = time.time()
ov.pp.neighbors(adata, n_neighbors=15, n_pcs=50,
                use_rep='scaled|original|X_pca')
time_log['neighbors'] = time.time() - t0

t0 = time.time()
ov.pp.umap(adata)
time_log['umap'] = time.time() - t0

t0 = time.time()
ov.pp.leiden(adata, resolution=1)
time_log['leiden'] = time.time() - t0
snap('after clustering')
print(f"Clusters: {adata.obs['leiden'].nunique()}")
🖥️ Using Scanpy CPU to calculate neighbors...

🔍 K-Nearest Neighbors Graph Construction:
   Mode: cpu
   Neighbors: 15
   Method: umap
   Metric: euclidean
   Representation: scaled|original|X_pca
   PCs used: 50
   🔍 Computing neighbor distances...
   🔍 Computing connectivity matrix...
   💡 Using UMAP-style connectivity
✓ Graph is fully connected

✅ KNN Graph Construction Completed Successfully!
   ✓ Processed: 7,698 cells with 15 neighbors each
   ✓ Results added to AnnData object:
     • 'neighbors': Neighbors metadata (adata.uns)
     • 'distances': Distance matrix (adata.obsp)
     • 'connectivities': Connectivity matrix (adata.obsp)

╭─ SUMMARY: neighbors ───────────────────────────────────────────────╮
│  Duration: 7.5234s                                                 │
│  Shape:    7,698 x 2,000 (Unchanged)                               │
│                                                                    │
│  CHANGES DETECTED                                                  │
│  ────────────────                                                  │
│  ● UNS    │ ✚ neighbors                                            │
│           │ └─ params: {'n_neighbors': 15, 'method': 'umap', 'random_s...│
│                                                                    │
│  ● OBSP   │ ✚ connectivities (sparse matrix, 7698x7698)            │
│           │ ✚ distances (sparse matrix, 7698x7698)                 │
│                                                                    │
╰────────────────────────────────────────────────────────────────────╯
🔍 [2026-04-16 22:34:11] Running UMAP in 'cpu' mode...
🖥️ Using Scanpy CPU UMAP...

🔍 UMAP Dimensionality Reduction:
   Mode: cpu
   Method: umap
   Components: 2
   Min distance: 0.5
{'n_neighbors': 15, 'method': 'umap', 'random_state': 0, 'metric': 'euclidean', 'use_rep': 'scaled|original|X_pca', 'n_pcs': 50}
   🔍 Computing UMAP parameters...
   🔍 Computing UMAP embedding (classic method)...
✅ UMAP Dimensionality Reduction Completed Successfully!
   ✓ Embedding shape: 7,698 cells × 2 dimensions
   ✓ Results added to AnnData object:
     • 'X_umap': UMAP coordinates (adata.obsm)
     • 'umap': UMAP parameters (adata.uns)
✅ UMAP completed successfully.

╭─ SUMMARY: umap ────────────────────────────────────────────────────╮
│  Duration: 5.6237s                                                 │
│  Shape:    7,698 x 2,000 (Unchanged)                               │
│                                                                    │
│  CHANGES DETECTED                                                  │
│  ────────────────                                                  │
│  ● UNS    │ ✚ umap                                                 │
│           │ └─ params: {'a': np.float64(0.5830300203414425), 'b': np.f...│
│                                                                    │
╰────────────────────────────────────────────────────────────────────╯
🖥️ Using Scanpy CPU Leiden...
running Leiden clustering
finished (0.44s)
    found 19 clusters and added
    'leiden', the cluster labels (adata.obs, categorical)

╭─ SUMMARY: leiden ──────────────────────────────────────────────────╮
│  Duration: 0.4441s                                                 │
│  Shape:    7,698 x 2,000 (Unchanged)                               │
│                                                                    │
│  CHANGES DETECTED                                                  │
│  ────────────────                                                  │
│  ● OBS    │ ✚ leiden (category)                                    │
│                                                                    │
│  ● UNS    │ ✚ leiden                                               │
│           │ └─ params: {'resolution': 1, 'random_state': 0, 'n_iterati...│
│                                                                    │
╰────────────────────────────────────────────────────────────────────╯
[after clustering] RSS = 917 MB
Clusters: 19
7. Visualization (all ov.pl, use_raw supported)#
All omicverse plotting functions work natively with AnnDataOOM.
hvg_gene = adata.var_names[0]
non_hvg_genes = list(set(adata.raw.var_names) - set(adata.var_names))[:3]
print(f'HVG gene: {hvg_gene}')
print(f'Non-HVG genes (raw only): {non_hvg_genes}')
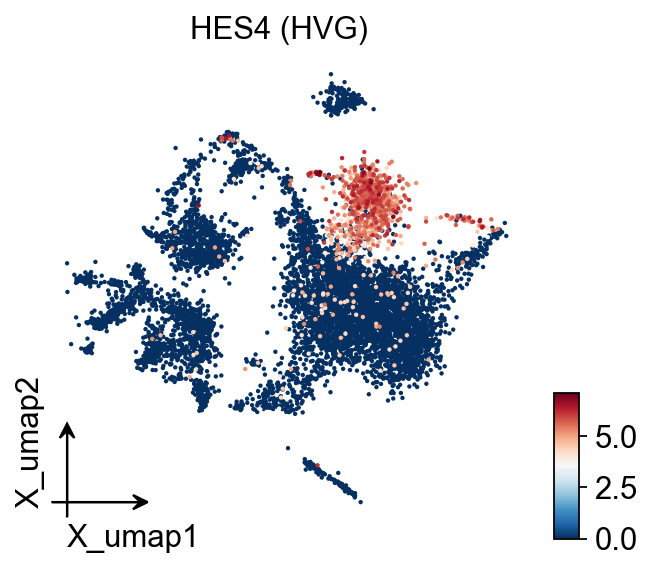
HVG gene: HES4
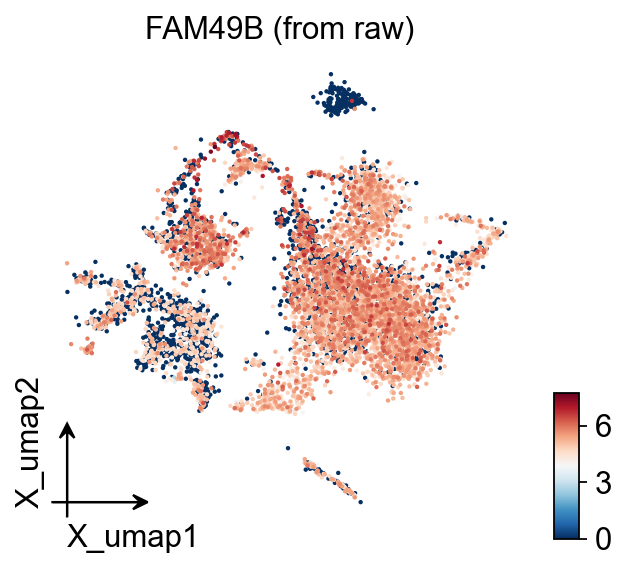
Non-HVG genes (raw only): ['FAM49B', 'NRIP3', 'C11orf95']
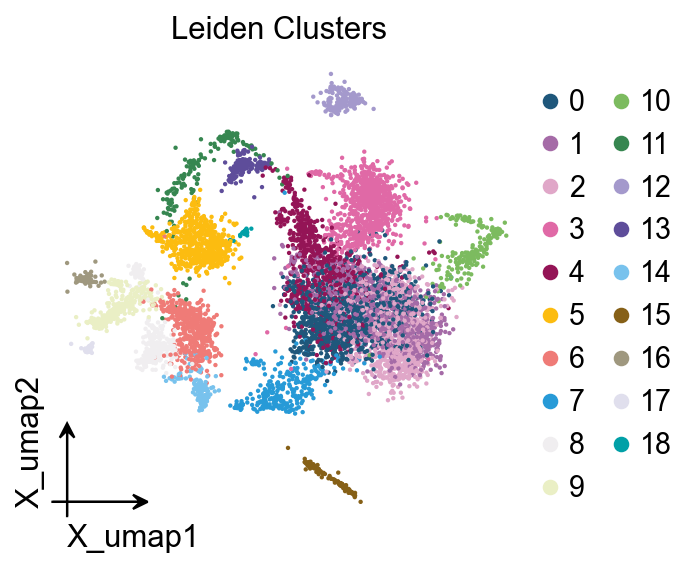
# Leiden clusters
ov.pl.embedding(adata, basis='X_umap', color='leiden',
                frameon='small', title='Leiden Clusters')
# Gene expression (HVG)
ov.pl.embedding(adata, basis='X_umap', color=hvg_gene,
                frameon='small', title=f'{hvg_gene} (HVG)')
# Gene from raw (use_raw=True)
ov.pl.embedding(adata, basis='X_umap', color=non_hvg_genes[0],
                use_raw=True, frameon='small',
                title=f'{non_hvg_genes[0]} (from raw)')
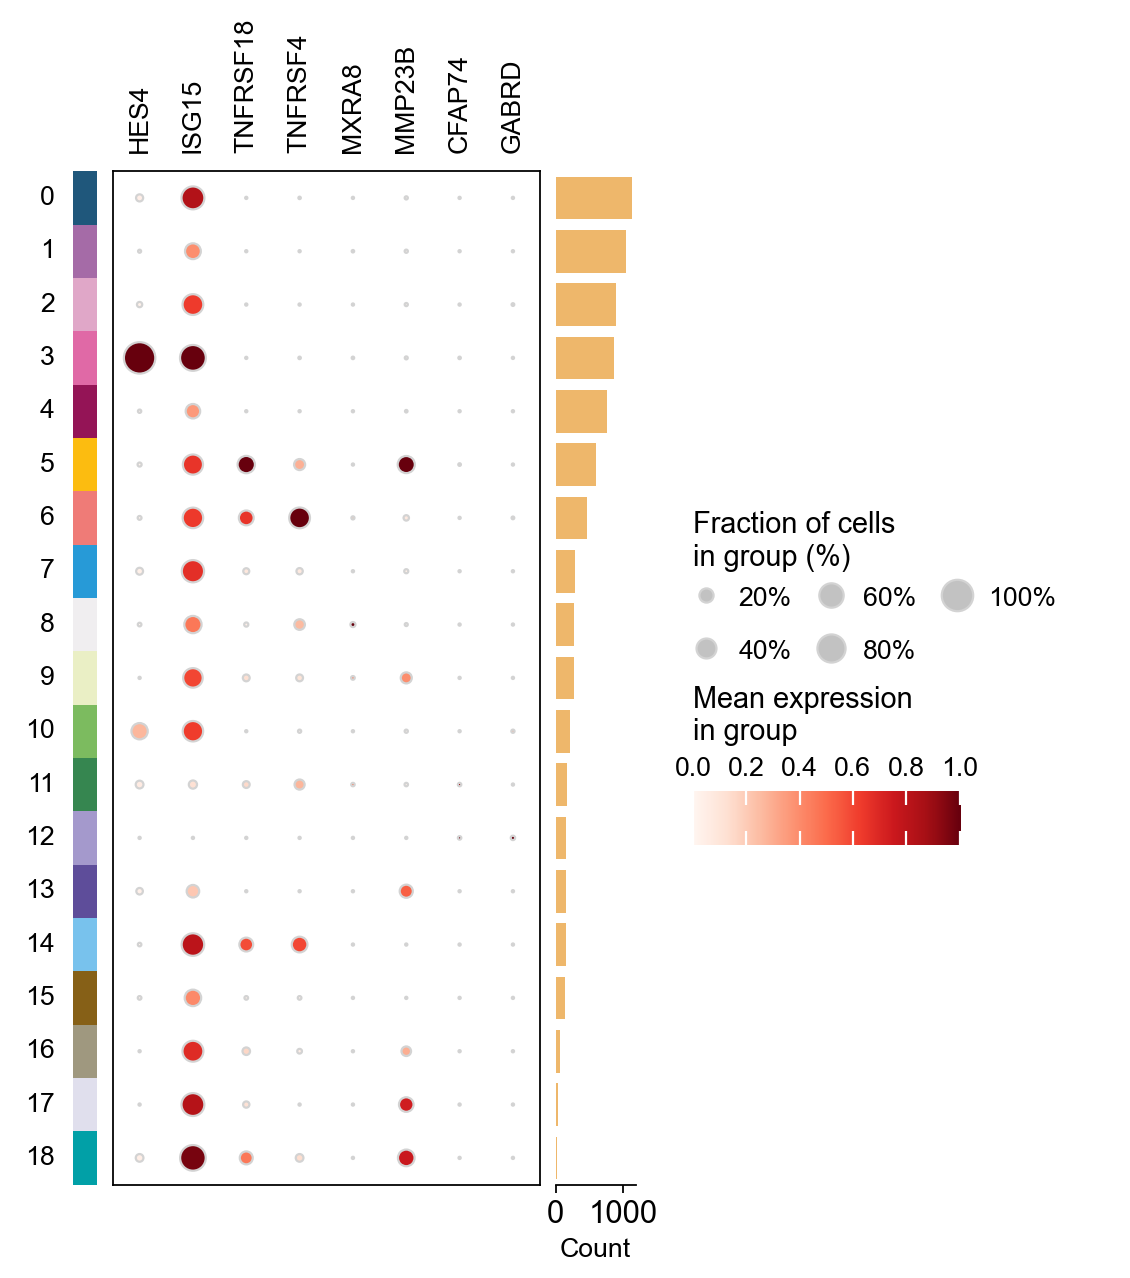
# Dotplot with HVG genes
ov.pl.dotplot(adata, list(adata.var_names[:8]),
              groupby='leiden', standard_scale='var')
<marsilea.heatmap.SizedHeatmap at 0x7fad2a51c700>
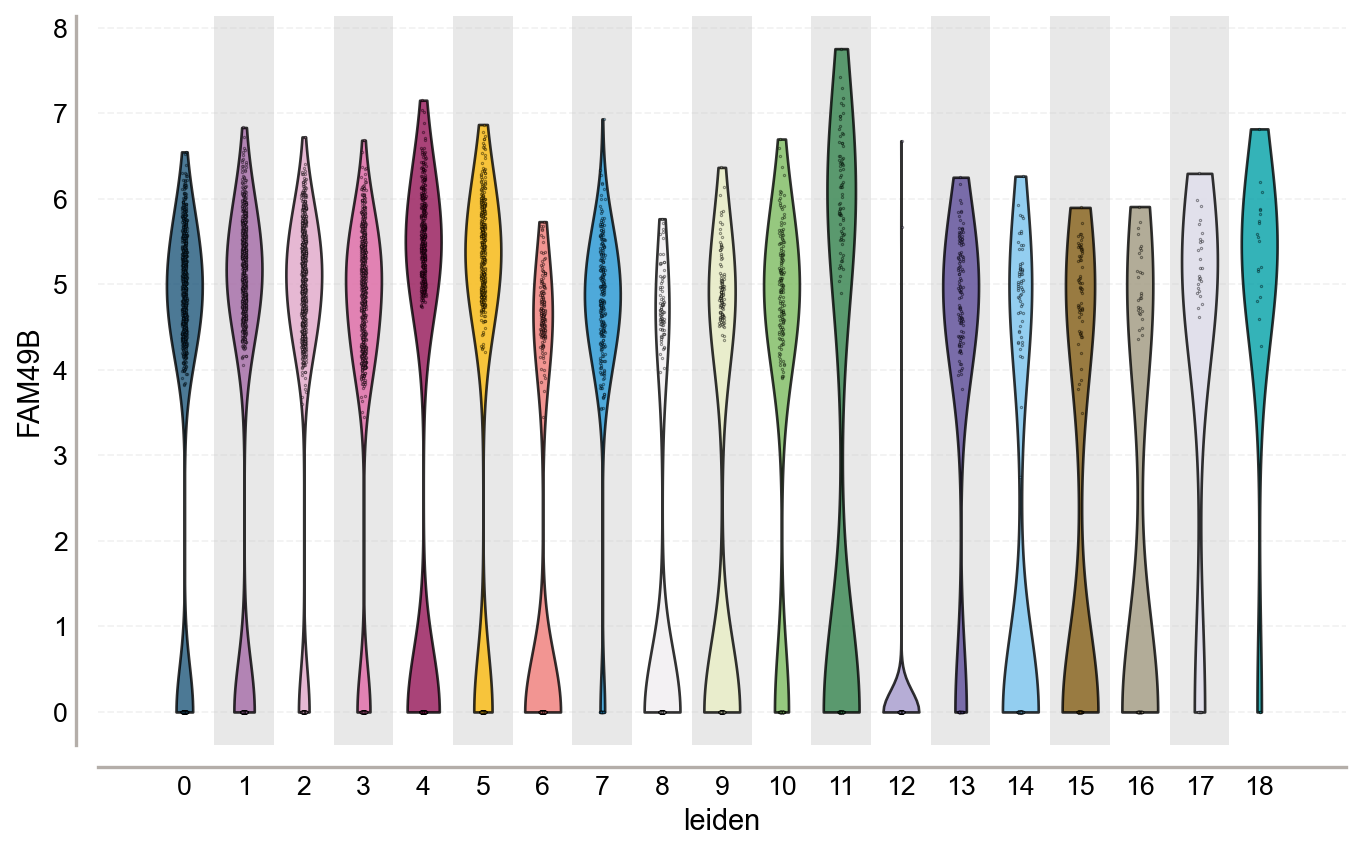
# Violin — gene from raw
ov.pl.violin(adata, keys=non_hvg_genes[0],
             groupby='leiden', use_raw=True)
<Axes: xlabel='leiden', ylabel='FAM49B'>
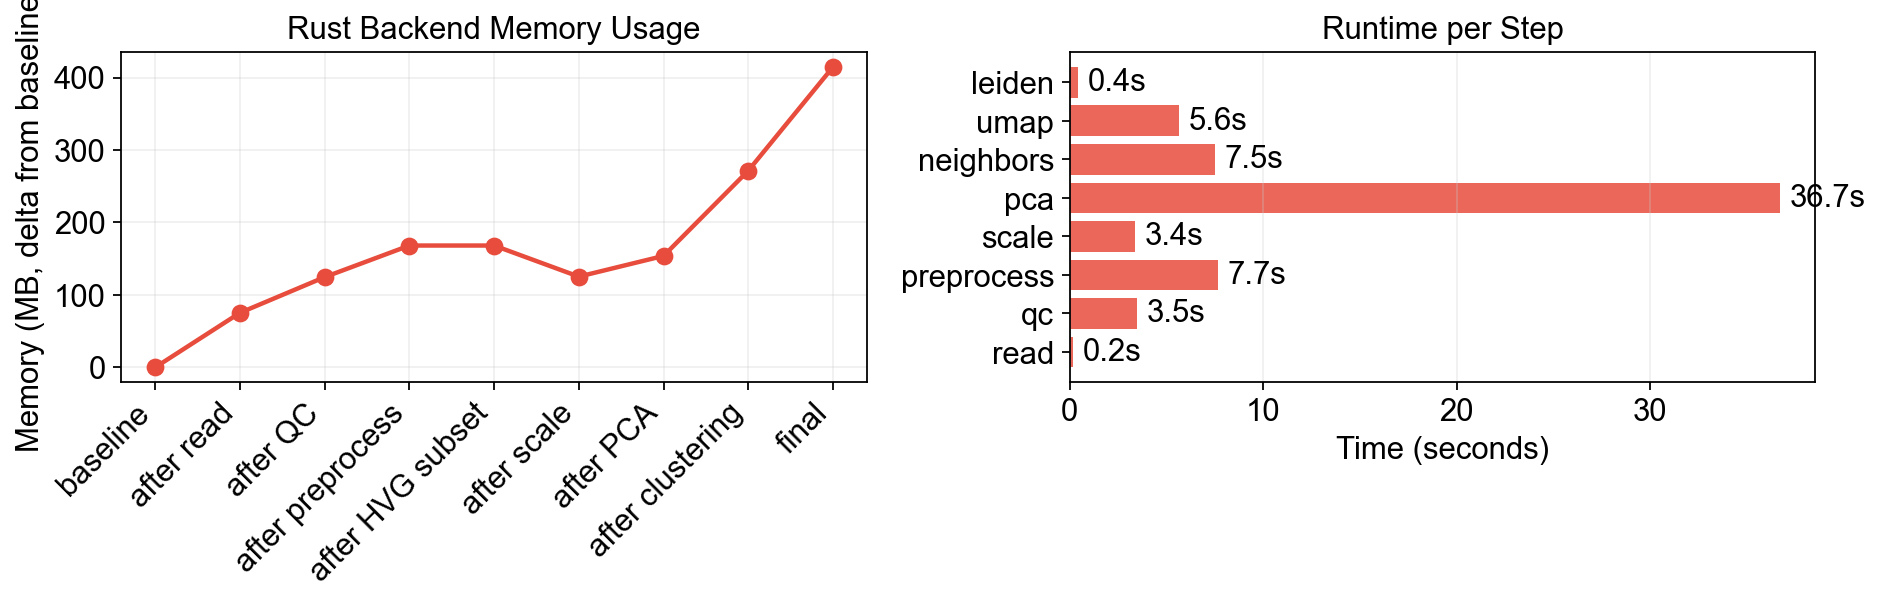
8. Memory & Runtime Summary#
snap('final')

df_mem = pd.DataFrame(mem_log)
df_mem['delta'] = df_mem['mem_mb'] - df_mem['mem_mb'].iloc[0]

fig, axes = plt.subplots(1, 2, figsize=(12, 4))

ax = axes[0]
ax.plot(range(len(df_mem)), df_mem['delta'], 'o-', color='#E74C3C', lw=2, ms=7)
ax.set_xticks(range(len(df_mem)))
ax.set_xticklabels(df_mem['step'], rotation=45, ha='right')
ax.set_ylabel('Memory (MB, delta from baseline)')
ax.set_title('Rust Backend Memory Usage')
ax.grid(True, alpha=0.3)

ax = axes[1]
steps = list(time_log.keys())
vals = [time_log[s] for s in steps]
ax.barh(steps, vals, color='#E74C3C', alpha=0.85)
ax.set_xlabel('Time (seconds)')
ax.set_title('Runtime per Step')
for i, v in enumerate(vals):
    ax.text(v + 0.5, i, f'{v:.1f}s', va='center')
ax.grid(True, alpha=0.3, axis='x')

plt.tight_layout()
plt.show()

print(f"Peak memory (delta): {df_mem['delta'].max():.0f} MB")
print(f"Total time:          {sum(time_log.values()):.1f}s")
[final] RSS = 1060 MB
Peak memory (delta): 415 MB
Total time:          65.0s
9. Comparison: Python vs Rust on PBMC 8k#
Benchmark results from running the identical pipeline with backend='python' vs backend='rust':
Step |
Python (MB) |
Rust (MB) |
Python (s) |
Rust (s) |
|---|---|---|---|---|
read |
148 |
37 |
0.1 |
0.3 |
qc |
— |
— |
— |
— |
preprocess |
328 |
24 |
7.4 |
6.3 |
hvg_subset |
450 |
24 |
0.0 |
0.0 |
scale |
382 |
54 |
1.3 |
2.6 |
pca |
846 |
33 |
1.1 |
53.5 |
neighbors |
1195 |
33 |
14.9 |
0.1 |
umap |
1500 |
34 |
7.1 |
4.5 |
leiden |
1502 |
33 |
363.3 |
338.6 |
PEAK |
1502 |
54 |
||
TOTAL |
397 |
407 |
Key observations:
Rust backend uses 27.8x less memory (1502 MB → 54 MB peak)
Total runtime is comparable (~400s, dominated by leiden clustering)
Memory stays flat across the entire pipeline for Rust backend
PCA is slower on Rust (53s) due to chunked randomized SVD, but this is independent of dataset size
Architecture: Lazy Transform Chain#
The full expression matrix is never loaded into memory:
X (HDF5 on disk, Rust I/O via anndata-rs)
  -> TransformedBackedArray (normalize: / per-cell size factors)
    -> TransformedBackedArray (log1p: on-the-fly)
      -> _SubsetBackedArray (HVG: 2000 gene columns)
        -> ScaledBackedArray (z-score: stores only mean/std vectors)
          -> Randomized SVD (chunked matrix products)
            -> X_pca (n_obs x 50, in-memory)
              -> Neighbors / UMAP / Leiden (operate on X_pca only)
Each transform node stores only a small descriptor (vector or flag), not matrices. Data is computed on-the-fly during chunked reads.
For 1M cells × 30k genes: Python ~120 GB, Rust ~700 MB (constant).
adata.close()